


The world of quantitative economics is complex. There are dozens of data providers hosting hundreds of different data points and thousands of individual metrics, all with the express goal of helping businesses make informed decisions about operations, marketing, and other foundational aspects of successful trade. Data, business, and marketing analysts or consultants create report after report to ingest these data and mine for factual insights to deliver to the executive suite, hoping to make an impact on the bottom or top line. This more traditional analytical strategy has a key strength – manual, human-derived insights that show clear patterns in data that can then be easily explained to the data laymen.
This strength also places traditional analytics at a disadvantage for many tasks stemming from the first statement we’ve made in this article: the world of quantitative economics is complex. Relationships between global economic indicators are typically not obvious. There can be multiple interactions that change the relationship between X and Y, depending on the value of Z; GDP and government investment in tech may be positively associated with one another, but only if the government has low debt, for example. This is a relatively simple case – the real relationships hidden in data sets are often even more complex than this as we add more and more metrics, effectively adding more dimensions to the data. The over-arching problem is that not many humans can see or think in 4, 5, or even 200 dimensions.
Machines, however, excel at this. We’ve developed computational algorithms and statistical models that are capable of ‘sniffing out’ patterns from noise, across thousands of dimensions, automatically. When done correctly, they search for generalizable sets of rules to explain what is happening in a data set, a power that even the most astute human can’t possess (in fact, humans are prone to seeing ‘patterns’ that don’t actually exists!). We can demonstrate this power with an example.
Suppose you’re a start-up looking to choose a new exporting market for your product. You’re searching for a market that has seen growth in import demand for the class of products you sell, and see that country A used to experience strong growth, but in the last few months has seemed to stagnate:
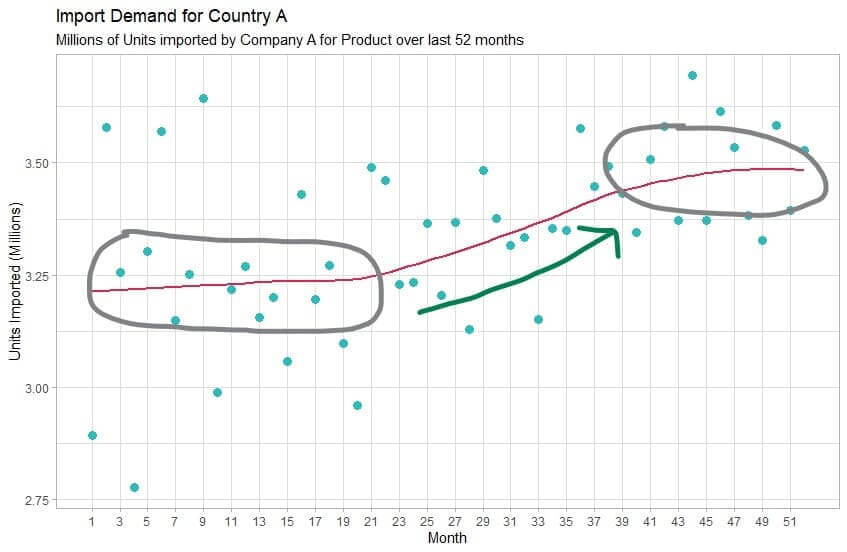
Of course, you want to make sure this growth stagnation is not permanent and given that the market has experienced high-growth demand for this product in the past, you think it’s plausible that it may occur again in the future. The bottom line is that you need to do your best to figure out what caused the growth in the first place and find signals that it may occur again. It’s easy to hypothesize a single reason why the growth would explode and stagnate, but given how complex economics can be, it’s extremely likely that there isn’t a single reason for this, but rather many factors that combine to create the effect seen in the chart.
In data science, this is a classic time series problem, where we’re trying to understand what could cause this metric to vary over time. We can collect multiple other metrics, such as GDP growth, types of policies adopted by the government, cultural indices, etc. from this country as well as other markets and compare them to one another via a machine learning algorithm. With a great data scientist running this project, the model will be able to ‘learn’ about the relationships between all these metrics and formulate rules about those relationships in a matter of minutes. Then, using those rules, the model can be used to forecast the market demand for the next month, quarter, or year (or beyond!) more accurately than an analyst could using heuristic methods. An output of this might look something like this:
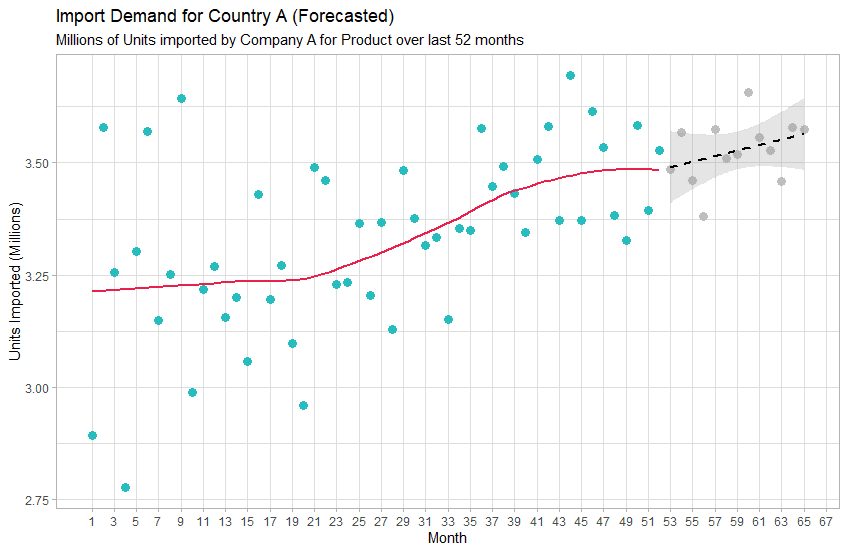
In this case, the model has determined based on the relationships in economic factors it found for this country and others that the demand for this product in this market is going to increase over the next 13 months. With more advanced data scientists and time, the same model could be used to find the reasons for this forecast – for instance, why the model forecasted an increase in demand rather than decrease or no change.
Conclusion
As computational power grows and new data sources become available, data science and machine learning are going to greatly expand on the abilities for businesses to make informed decisions. This is especially true for market selection problems, where having some concrete evidence for future economic states can make or break a new exporter choice. If you’re not already investing in data science, now is the time to start.